How to Use cPanel’s Metrics Section to Improve Site Performance
 Samuel Lester
 June 22, 2025


 Samuel Lester
June 22, 2025
Samuel Lester
June 22, 2025
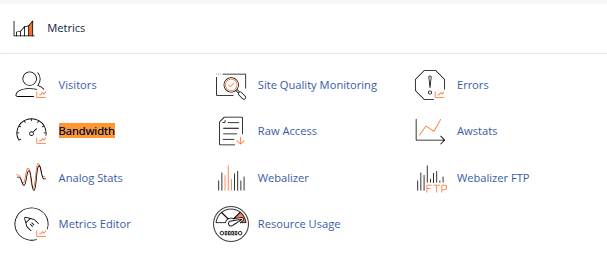
If your website is slow, experiencing downtime, or not ranking well in search engines, the first place to look for answers is your hosting control panel specifically, the Metrics section in cPanel. This underrated toolkit provides vital insights into your website’s traffic, errors, and resource usage. Knowing how to interpret these reports can help you proactively fix problems and boost performance.
In this guide, we’ll break down the key tools in the Metrics section and how to use them effectively.
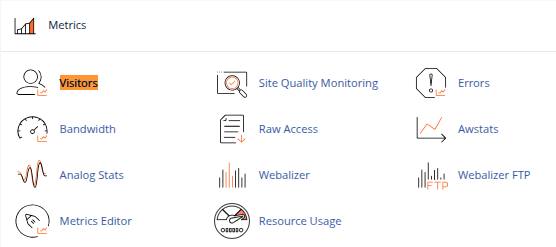
The Visitors feature gives you a real-time view of who is accessing your website, including:
IP addresses
Requested URLs
User agents (browsers/devices)
Time of access
Use it to:
Spot suspicious activity or unusual spikes in traffic
Understand which pages are getting the most views
Identify and block bots or malicious IPs using .htaccess or firewall rules
Pro tip: Combine Visitor logs with AWStats or Google Analytics to get both raw server data and user-friendly charts.
The Errors section shows the last 300 log entries from your site’s error log.
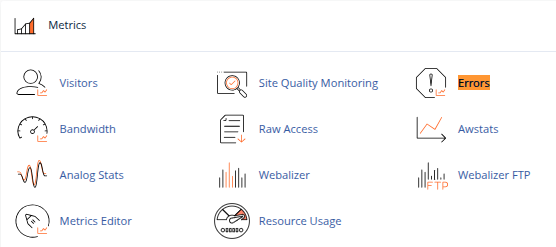
Common errors to look for:
404 Not Found: Missing pages, broken links, or bad SEO redirects
500 Internal Server Error: Faulty plugins, themes, or misconfigured .htaccess
403 Forbidden: Incorrect file permissions or IP blocks
Use it to:
Catch broken links or plugins after a WordPress update
Troubleshoot server-side issues quickly
Monitor PHP errors in custom applications
Quick Fix: If you see repeated errors, increase PHP memory limit or check file permissions.
If your site gets suspended for exceeding limits, the Resource Usage tool (typically powered by CloudLinux or similar) helps you figure out why.
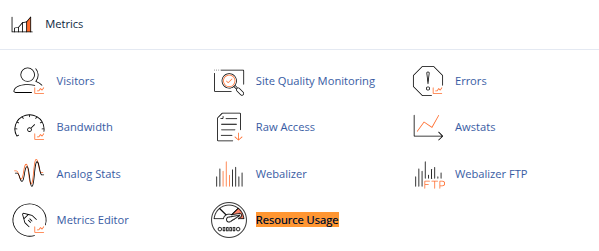
Metrics include:
CPU usage
Memory usage
Entry processes
I/O (disk) usage
Use it to:
Spot inefficient plugins or scripts eating up resources
Know when to upgrade to a higher hosting plan
View historical usage trends to prevent future downtime
Watch for: “Faults” or “limit hits” these are signs your site is under heavy load or poorly optimized.
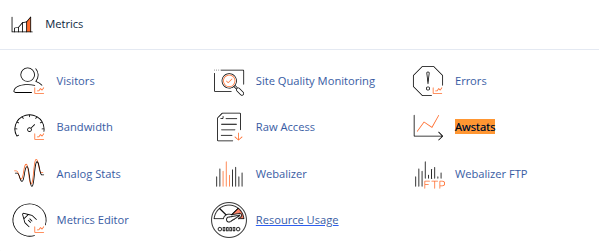
Awstats is a powerful traffic analysis tool that presents:
Monthly, daily, and hourly traffic
Visitor origin by country/IP
Most viewed pages and downloads
Search engine keywords (limited by modern privacy restrictions)
Use it to:
Find your most (and least) popular content
Analyze peak traffic times to schedule backups or updates
Identify potential markets or referral sources
The Bandwidth tool shows how much data your site consumes, split by:
HTTP
FTP
IMAP/POP3 (mail)
Use it to:
Avoid overage fees on limited hosting plans
Spot unusual activity like download abuse or DDoS attempts
Tip: If bandwidth usage spikes suddenly, investigate logs or enable rate limiting.
cPanel’s Metrics section is often overlooked, but it holds the key to understanding and improving your website’s performance. By regularly checking these tools, you can:
Catch issues before they cause downtime
Optimize your website and hosting plan
Improve SEO and user experience
Next time you log into cPanel, don’t just head straight to File Manager or WordPress – take a few minutes to explore the Metrics section. It could save you hours of troubleshooting later.